Big data has become an increasingly popular, as more business users seek to leverage analytics for innovative improvements. But, without visual representations of big data, insights can be difficult to obtain. So, it is key to choose a right visualization tool. So, ask these questions while considering data visualization applications to ensure ease of use and optimal functionality. There is obviously no single answers, because tools vary depending on the task they are meant to achieve.
1. Do I need to visualize data inline, offline, or both?
2. Can this visualization tool(s) handle my data?
3. Does this visualization tool(s) offer the features I need?
4. Can I adjust my visualization to my application’s needs?
5. Do I need to visualize measurement data synchronized with data from other sources?
6. Does it have the ability to prepare info graphics by attaching data values to custom shapes in context?
7. Is it mobile ready?
8. Does it support cross publishing of real-time visualizations using web widgets
9. Is it ready to deploy on private cloud?
10. How do you define and measure the quality of a chart?
11. Does it allow you to produce interactive graphs or maps?
12. Can it be accessed via an API, in batch mode?
13. Does it allow you to easily produce videos about of your data?
14. Is it a best alternative to Excel, offering the same features, but having much better data modelling capabilities?
15. Is it easy to produce nice graph structures to visually display connections?
16. Can it make heat maps?
17. How do you draw “force-directed graphs”?
18. Is it a good tool for raster images? for vector images? for graphs? for decision trees? for fractals? for time series? for stock prices? for maps? for spatial data?
19. Can you integrate R with other graphical packages?
20. How do you represent 5 dimensions (e.g. time, volume, category, price, location) in a simple 2-dimensional graph?
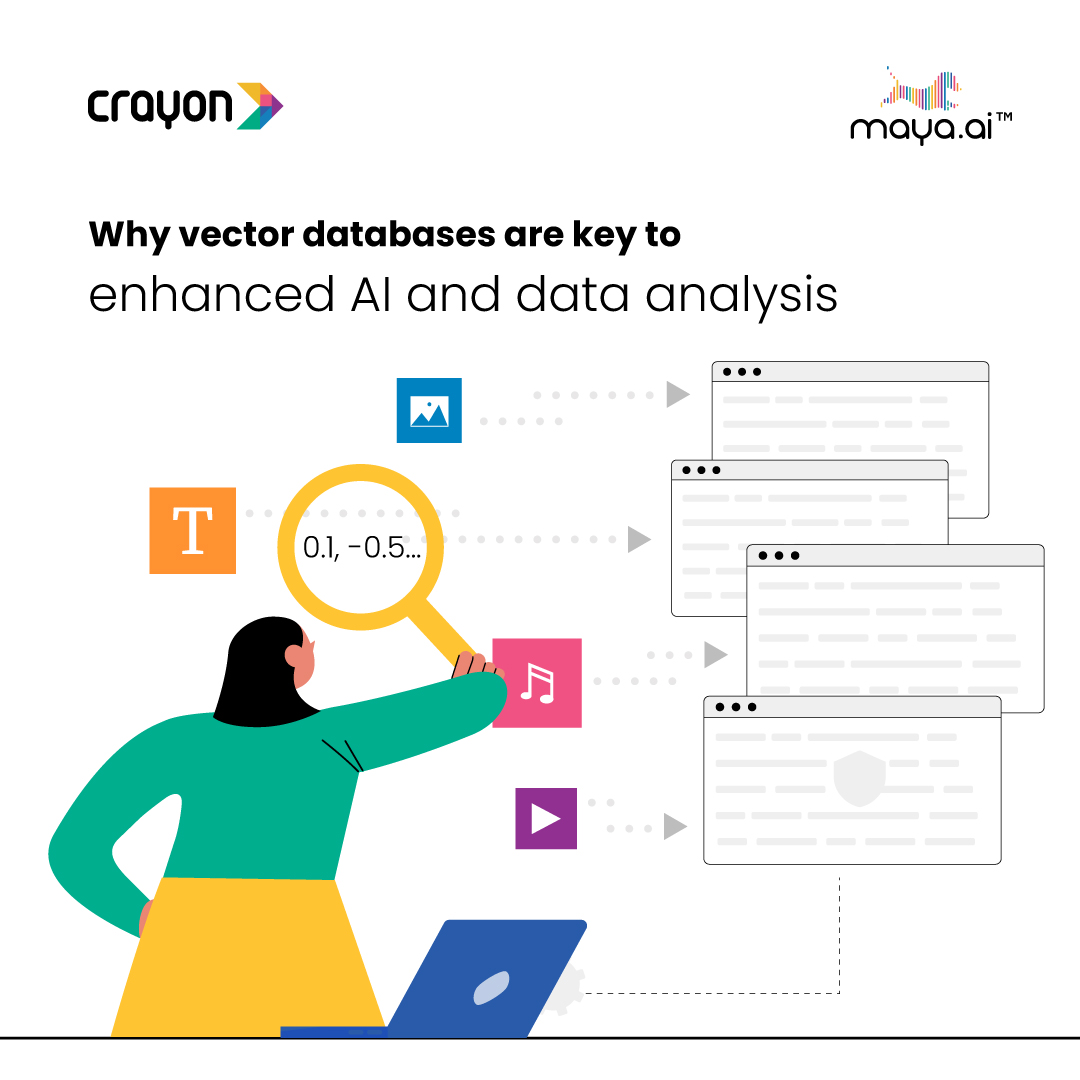
Why vector databases are key to enhanced AI and data analysis
In a...
