Big data is growing increasingly important. It can shape many core actions businesses take. As a result, it’s important that you understand how best to communicate the importance of this data. This is especially critical, as many decision-making managers simply don’t share your technical expertise or the typical jargon used.
There are several things you need to consider when preparing to give a presentation on big data. The first factor is who will be watching.
Know your audience
Some people may take nothing more than an educational experience out of your presentation, while others may be making business decisions based on what you say. As a result, it is important to understand what they hope to achieve from attending your presentation.
Regardless of the number of people attending, whether it’s small and intimate or large and formal, you should try to ascertain their goal, and from there build your presentation to meet that. By doing this you can guarantee that they’ll find value in the topic at hand.
Another thing you should consider when preparing your meeting is how to tailor your message to suit your audience. For instance, people you present to may not do well with numbers but are great with overall concepts. You can adjust what you say to allow them to get more out of your presentation.
One factor that you should also understand is why are people watching your presentation. Are attendees likely to be particularly interested in what you have to say? What are they hoping to get from your presentation at its conclusion?
While relatively unimportant, you should also consider where you’re giving the presentation. Is it a small room, with few guests? Or is it in a large hall with many people watching. The way you use your space can, and should, change how you deliver the core message.
You don’t need to spend hours planning all of this out. By giving some of these factors even a few moments of your time, you’ll be much better equipped to give a great presentation. Every successful presentation requires not only the presenter to provide information, but for the audience to learn. As a result, to ensure success you need to not only plan and prepare your own content but also tailor the delivery so your audience can learn as much as possible.
By tailoring your presentation to your audience you can ensure that they retain as much as possible and maintain a positive level of interest throughout your presentation.
Use visuals
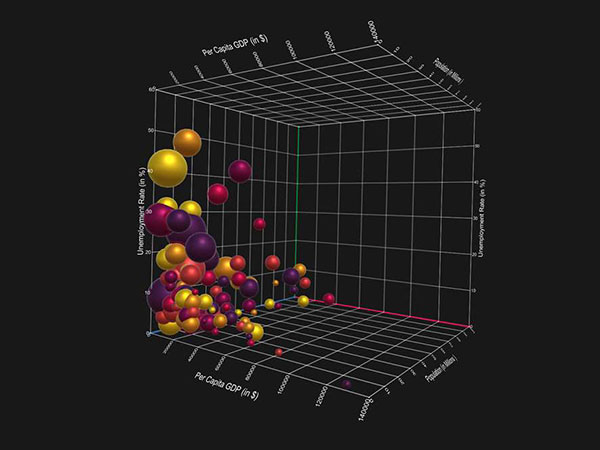
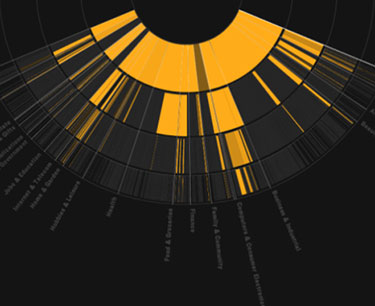
Big data is inherently very mathematically based. Even if you’re presenting to people who are very math-centric, it can be much more effective to show that information in the form of visuals. Software such as Tableau can do a fantastic job of creating stylish dashboards and other visually engaging mediums. Regardless to what tool you use, visuals are a fantastic way to present a lot of information in a digestible format.
An often overlooked factor when discussing visuals in presentations is the fact that well-made visuals allow the presenter to control the order of information absorption. For instance, people tend to focus on larger objects in brighter colours first. You can use this fact to create a starting point for the story you’re trying to tell.
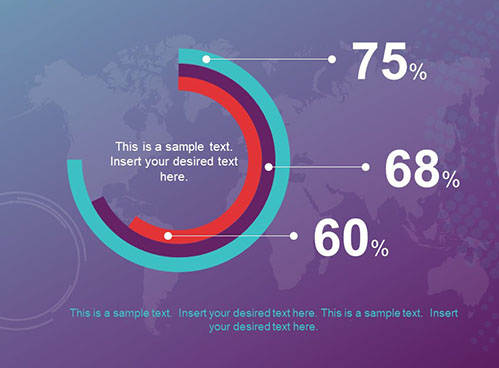
One of the best reasons to use visuals within a presentation is to help ensure memory retention. Most people remember pictures better than words, and so can associate the ideas of what you’re saying with the image you’re conveying it with.
Another fantastic reason to use visual designs within presentations is because they increase overall interest. If you’re talking over plain text, you’re quickly going to lose the audience’s interest.
Visual designs are also often used by speakers as a way of reminding themselves of key points. If you do use this, you’ll be able to focus much more on what you’re saying and explaining, rather than worrying about discussing content that follows it.
There are two ways you can tell if a visual aid is appropriate for your discussion. The first is if it would save you words. It is always better to show results rather than describing them. Another way to tell if it’s a good time for a visual design is if the impact of presenting it visually would be greater than the spoken word.
Visual aids are an extremely potent tool when giving a presentation, but especially when the presentations involve complex mathematical information, as big data presentations often do.
Ensure understanding
One of the biggest pitfalls when giving a presentation is the assumption of knowledge. Unless you’re sure that your audience has a minimum level of understanding sufficient to fully grasp the topics being discussed, provide the necessary baseline.
This can be done in a quick primer. For instance, if you’re discussing data mining, it may be prudent to explain the bare bones basics of the process. This way, you can ensure that everyone’s on the same page. From there, you simply need to logically move along the topics in an order that convey true understanding.
Especially when discussing big data, the need to emphasize security is paramount. Without a method of ensuring that your data can survive, you’re risking the future decision-making ability of your organization. As a result, you should emphasize security whenever discussing big data with the decision making leadership team.
Big data presentations can be intimidating. For many, this is a foreign topic they feel overwhelmed by. It’s important that your presentation educates and inform in the way intended while meeting the individual goals of your audience members. By taking careful consideration of the type of people watching your work, you can tailor the experience to better suit their characteristics and, ultimately, have much more success.