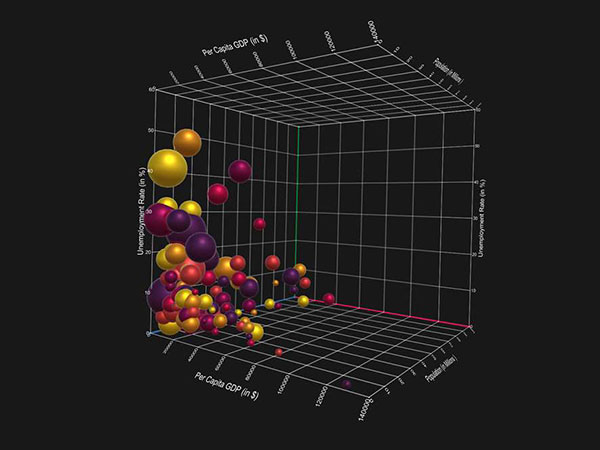
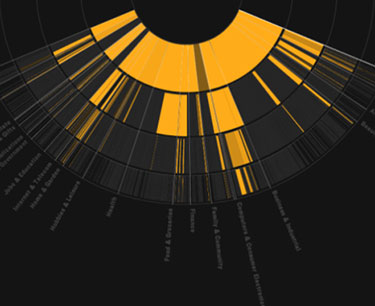
Are you a hard-core enthusiast of data visualization? Or a beginner, who wants to learn and be able to create more effective visualisations? Check out our list of 35 invaluable books you must read for better visualization. (Some books in the list might not be directly connected to data visualization as such, but we included them because they were highly recommended by many data visualization experts. And the way books are arranged in the list has no particular order.)
Books on Data Visualization
1. The Visual Display of Quantitative Information
Author: by Edward Tufte
Publisher: Graphics Press, 1983
Pages: 197
A modern classic. Tufte teaches the fundamentals of graphics, charts, maps and tables. “A visual Strunk and White” (The Boston Globe). Includes 250 delightfullly entertaining illustrations, all beautifully printed.
2. Visualize This: The FlowingData Guide to Design, Visualization, and Statistics
Author: Nathan Yau
Publisher: John Wiley & Sons, 2011
Pages: 384
Practical data design tips from a data visualization expert of the modern age. Presents a unique approach to visualizing and telling stories with data, from a data visualization expert and the creator of flowingdata.com, Nathan Yau. Offers step-by-step tutorials and practical design tips for creating statistical graphics, geographical maps, and information design to find meaning in the numbers. Details tools that can be used to visualize data-native graphics for the Web, such as ActionScript, Flash libraries, PHP, and JavaScript and tools to design graphics for print, such as R and Illustrator. Contains numerous examples and descriptions of patterns and outliers and explains how to show them.
3. Semiology of Graphics: Diagrams, Networks, Maps
Author: Jacques Bertin
Publisher: Esri Press, 2010)
Pages: 456
Originally published in French in 1967, Semiology of Graphics holds a significant place in the theory of information design. Founded on Jacques Bertin’s practical experience as a cartographer, Part One of this work is an unprecedented attempt to synthesize principles of graphic communication with the logic of standard rules applied to writing and topography. Part Two brings Bertin’s theory to life, presenting a close study of graphic techniques including shape, orientation, color, texture, volume, and size in an array of more than 1,000 maps and diagrams.
4. Visual Thinking: for Design
Author: Colin Ware
Publisher: Morgan Kaufmann Publishers In, 2008
Pages: 256
In Visual Thinking for Design, Colin Ware takes what we now know about perception, cognition, and attention and transforms it into concrete advice that designers can directly apply. He demonstrates how designs can be considered as tools for cognition – extensions of the viewer’s brain in much the same way that a hammer is an extension of the user’s hand. Experienced professional designers and students alike will learn how to maximize the power of the information tools they design for the people who use them.
5. Information Visualization: Perception for Design
Author: Colin Ware
Publisher: Morgan Kaufmann, 2004
Pages: 486
Most designers know that yellow text presented against a blue background reads clearly and easily, but how many can explain why, and what really are the best ways to help others and ourselves clearly see key patterns in a bunch of data? This book explores the art and science of why we see objects the way we do. Based on the science of perception and vision, the author presents the key principles at work for a wide range of applications–resulting in visualization of improved clarity, utility, and persuasiveness.
6. Information Dashboard Design: Displaying Data for at-a-glance Monitoring
Author: Stephen Few
Publisher: Analytics Press, 2013
Pages: 260
A leader in the field of data visualization, Stephen Few exposes the common problems in dashboard design and describes its best practices in great detail and with a multitude of examples in this updated second edition. According to the author, dashboards have become a popular means to present critical information at a glance, yet few do so effectively. He purports that when designed well, dashboards engage the power of visual perception to communicate a dense collection of information efficiently and with exceptional clarity and that visual design skills that address the unique challenges of dashboards are not intuitive but rather learned. The book not only teaches how to design dashboards but also gives a deep understanding of the concepts rooted in brain science that explain the why behind the how.
7. Data Visualization: a successful design process
Author: Andy Kirk
Publisher: Packt Publishing Limited, 2012
Pages: 206
The author explains A structured design approach to equip you with the knowledge of how to successfully accomplish any data visualization challenge efficiently and effectively. He explains a portable, versatile and flexible data visualization design approach that will help you navigate the complex path towards success. Explains the many different reasons for creating visualizations and identifies the key parameters which lead to very different design options.
8. The Visual Organization: Data Visualization, Big Data, and the Quest for Better Decisions
Author: Phil Simon
Publisher: Wiley, 2014
Pages: 240
In The Visual Organization, award-winning author and technology expert Phil Simon looks at how an increasingly number of organizations are embracing new dataviz tools and, more important, a new mind-set based upon data discovery and exploration. Simon adroitly shows how Amazon, Apple, Facebook, Google, Twitter, and other tech heavyweights use powerful data visualization tools to garner fascinating insights into their businesses. But make no mistake: these companies are hardly alone. Organizations of all types, industries, sizes are representing their data in new and amazing ways. As a result, they are asking better questions and making better business decisions.
9. The Functional Art: An introduction to information graphics and visualization
Author: Alberto Cairo
Publisher: New Riders, 2012
Pages: 384
The first book to offer a broad, hands-on introduction to information graphics and visualization, The Functional Art reveals: Why data visualization should be thought of as “functional art” rather than fine art; how to use color, type, and other graphic tools to make your information graphics more effective, not just better looking; the science of how our brains perceive and remember information; best practices for creating interactive information graphics; a comprehensive look at the creative process behind successful information graphics; an extensive gallery of inspirational work from the world’s top designers and visual artists.
10. Visualizing Data: Exploring and Explaining Data with the Processing Environment
Author: Ben Fry
Publisher: O’Reilly Media, 2008
Pages: 384
With Visualizing Data as a guide, you’ll learn basic visualization principles, how to choose the right kind of display for your purposes, and how to provide interactive features that will bring users to your site over and over. This book teaches you: the seven stages of visualizing data — acquire, parse, filter, mine, represent, refine, and interact; how all data problems begin with a question and end with a narrative construct that provides a clear answer without extraneous details; several example projects with the code to make them work; positive and negative points of each representation discussed. The focus is on customization so that each one best suits what you want to convey about your data set.
11. The Accidental Analyst: Show Your Data Who’s Boss
Authors: Eileen and Stephen McDaniel
Publisher: CreateSpace Independent Publishing Platform, 2012
Pages: 300
Are you drowning in a sea of data? Would you like to take control of your data and analysis to quickly answer your business questions and make critical decisions? Do you want to confidently present results and solutions to managers, colleagues, clients and the public? Read this book for inspiration, ideas and confidence to begin tackling the problems you face at work.
12. The Wall Street Journal Guide to Information Graphics: The Dos and Don’ts of Presenting Data, Facts, and Figures
Author: Dona M. Wong
Publisher: W. W. Norton & Company, 2010
Pages: 160
In today’s data-driven world, professionals need to know how to express themselves in the language of graphics effectively and eloquently. This book teaches: to choose the best chart that fits your data; the most effective way to communicate with decision makers when you have five minutes of their time; how to chart currency fluctuations that affect global business; how to use color effectively; how to make a graphic “colorful” even if only black and white are available.
13. The Visual Miscellaneum: A Colorful Guide to the World’s Most Consequential Trivia
Author: David McCandless
Publisher: Harper Design, 2009
Pages: 156
The Visual Miscellaneum is a unique, groundbreaking look at the modern information age, helping readers make sense of the countless statistics and random facts that constantly bombard us. Using cutting edge graphs, charts, and illustrations, David McCandless creatively visualizes the world’s surprising relationships and compelling data, covering everything from the most pleasurable guilty pleasures to how long it takes different condiments to spoil to world maps of Internet search terms.
14. Interactive Data Visualization for the Web
Author: Scott Murray
Publisher: O’Reilly, 2013
Pages: 272
Want to create and publish your own interactive data visualization projects on the Web—even if you have little or no experience with data visualization or web development. It’s easy and fun with this practical, hands-on introduction. Author Scott Murray teaches you the fundamental concepts and methods of D3, a JavaScript library that lets you express data visually in a web browser. Along the way, you’ll expand your web programming skills, using tools such as HTML and JavaScript.
15. Show Me the Numbers: Designing Tables and Graphs to Enlighten
Author: Stephen Few
Publisher: Analytics Press, 2004
Pages: 280
Tables and graphs can more adequately communicate important business information when they reflect the good design practices discussed in this practical guide to effective table and graph design. Tables and graphs present quantitative business information in a truthful, attractive format that facilitates better decision making.
16. Readings in Information Visualization: Using Vision to Think
Editors: Stuart K. Card, Jock Mackinlay, Ben Shneiderman
Publisher: Morgan Kaufmann, 1999
Pages: 712
This groundbreaking book defines the emerging field of information visualization and offers the first-ever collection of the classic papers. The authors’ intention is to present the use of visualization to discover relationships, using interactive graphics to amplify thought.
17. Beautiful Visualization: Looking at Data through the Eyes of Experts
Editors: Julie Steele, Noah Iliinsky
Publisher: O’Reilly Media, 2010
Pages: 418
This book examines the methods of two dozen visualization experts who approach their projects from a variety of perspectives — as artists, designers, commentators, scientists, analysts, statisticians, and more. Together they demonstrate how visualization can help us make sense of the world.
18. Data Flow : Design graphique et visualisation d’information
Author: Robert Klanten
Translator: Gilles Berton
Publisher: Thames & Hudson, 2009
A great book for graphic designers, architects etc. It has inspiring Graphics that make boring data visually interesting. Useful book to find new ways to convey information.
19. Data Flow 2: Visualizing Information in Graphic Design
Editors: Robert Klanten, N. Bourquin, S. Ehmann
Publisher: Die Gestalten Verlag, 2010
Pages: 272
Data Flow 2 expands the definition of contemporary information graphics. The book features new possibilities for diagrams, maps, and charts. It investigates the visual and intuitive presentation of processes, data, and information. Concrete examples of research and art projects as well as commercial work illuminate how techniques such as simplification, abstraction, metaphor, and dramatization function.
20. Information Graphics: A Comprehensive Illustrated Reference
Authors: Robert L. Harris
Publisher: Oxford University Press, 2000
Pages: 448
This beautifully illustrated book is the first complete handbook to visual information. It describes the full range of charts, graphs, maps, diagrams, and tables used daily to manage, analyze, and communicate information. It features over 3,000 illustrations, making it an ideal source for ideas on how to present information.
21. Visual Meetings: How Graphics, Sticky Notes and Idea Mapping Can Transform Group Productivity
Author: David Sibbet
Publisher: Wiley, 2010
Pages: 288
Want to use eye-popping visual tools to energize your people? Visual Meetings explains how anyone can implement powerful visual tools, and how these tools are being used in Silicon Valley and elsewhere to facilitate both face-to-face and virtual group work. This dynamic and richly illustrated resource gives meeting leaders, presenters, and consultants a slew of exciting tricks and tool.
22. Information Dashboard Design: The Effective Visual Communication of Data
Author: Stephen Few
Publisher: O’Reilly Media, 2006
Pages: 224
Dashboards have become popular in recent years as uniquely powerful tools for communicating important information at a glance. This book will teach you the visual design skills you need to create dashboards that communicate clearly, rapidly, and compellingly. Information Dashboard Design will explain how to: Avoid the thirteen mistakes common to dashboard design; provide viewers with the information they need quickly and clearly; apply what we now know about visual perception to the visual presentation of information.
23. Understanding Comics
Author: Scott McCloud
Publisher: William Morrow Paperbacks, 1994
Pages: 224
Praised throughout the cartoon industry by such luminaries as Art Spiegelman, Matt Groening, and Will Eisner, this innovative comic book provides a detailed look at the history, meaning, and art of comics and cartooning.
24. Visual Explanations: Images and Quantities, Evidence and Narrative
Author: Edward R. Tufte
Publisher: Graphics Press USA, 1997
Pages: 151
Describes design strategies – the proper arrangement in space and time of images, words, and numbers – for presenting information about motion, process, mechanism, cause, and effect. Examines the logic of depicting quantitative evidence.
25. Envisioning Information
Author: Edward R. Tufte
Publisher: Graphics Press USA, 1990
Pages: 126
The book has a remarkable range of examples for the idea of visual thinking, with beautifully printed pages. A real treat for all who reason and learn by means of images.
26. Sketching User Experiences: Getting the Design Right and the Right Design
Author: Bill Buxton
Publisher: Morgan Kaufmann Publishers In, 2007
Pages: 448
Sketching User Experiences approaches design and design thinking as something distinct that needs to be better understood-by both designers and the people with whom they need to work- in order to achieve success with new products and systems. So while the focus is on design, the approach is holistic. Hence, the book speaks to designers, usability specialists, the HCI community, product managers, and business executives.
27. The Elements of Graphing Data
Author: William S. Cleveland
Publisher: Hobart Pr, 1994
Pages: 297
The book presents visualization methods in science and technology. Many new ideas and methods; many not widely known before. Excellent methodological resource for research workers.
28. Visualizing Data
Author: William S. Cleveland
Publisher: Hobart Press, 1993
Pages: 360
The book is much more than just a compendium of useful tools. It conveys a strategy for data analysis that stresses the use of visualization to thoroughly study the structure of data and to check the validity of statistical models fitted to data. The result of the tools and the strategy is a vast increase in what you can learn from your data. The book demonstrates this by reanalyzing many data sets from the scientific literature, revealing missed effects and inappropriate models fitted to data.
29. Visualization of Time-Oriented Data
Authors: Wolfgang Aigner, Silvia Miksch, Heidrun Schumann and Christian Tominski
Publisher: Springer, 2011
Pages: 286
Time is an exceptional dimension that is common to many application domains such as medicine, engineering, business, or science. Due to the distinct characteristics of time, appropriate visual and analytical methods are required to explore and analyze them. This book starts with an introduction to visualization and historical examples of visual representations. At its core, the book presents and discusses a systematic view of the visualization of time-oriented data along three key questions: what is being visualized (data), why something is visualized (user tasks), and how it is presented (visual representation).
30. How to Lie with Statistics
Author: Darrell Huff
Illustrator: Irving Geis
Publisher: W. W. Norton & Company, 1993
Pages: 144
Darrell Huff runs the gamut of every popularly used type of statistic, probes such things as the sample study, the tabulation method, the interview technique, or the way the results are derived from the figures, and points up the countless number of dodges which are used to full rather than to inform.
31. Cartographies of Time: A History of the Timeline
Author: Daniel Rosenberg
Publisher: Princeton Architectural Press, 2012
Pages: 272
What does history look like? Cartographies of Time is the first history of the timeline, written engagingly and with incredible visuals. The authors, both accomplished writers and historians, sketch the shifting field of graphic representations of history from the beginning of the print age through the present. They shed light on western views of history and on the complex relationship between general ideas about the course of events and the technical efforts to record and connect dates and names in the past.
32. We Feel Fine: An Almanac of Human Emotion
Authors: Sep Kamvar, Jonathan Harris
Publisher: Scribner, 2009
Pages: 288
We Feel Fine is no ordinary book. It explores our emotions from every angle, providing insights into and examples of each. With thousands of authors from all over the world sharing their uncensored emotions, it is a radical experiment in mass authorship, merging the online and offline worlds to create an indispensable handbook for anyone interested in what it’s like to be human.
33. Sync: The Emerging Science of Spontaneous Order
Author: Steven H. Strogatz
Publisher: Penguin, 2004
Pages: 352
‘Sync’ is a story of a dazzling kind of order in the universe, the harmony that comes from cycles in sync. The tendency to sychronize is one of the most far- reaching drives in all of nature. It extends from people to planets, from animals to atoms. In ‘sync’, professor Steven Strogatz considers a range of applications – human sleep and circadian rhythms, menstrual synchrony, insect outbreaks, superconductors, lasers, secret codes, heart arrhythmias and fads – connecting all trhough an exploration of the same mathematical theme: self- organisation or the spontaneous emergence of order out of chaos.
34. Art Forms in Nature: Prints of Ernst Haekel
Authors: Olaf Breidbach, Irenaus Eibl-Eibersfeldt, Richard Hartmann
Publisher: Prestel, 2008
Pages: 140
The geometric shapes and natural forms, captured with exceptional precision in Ernst Haeckel’s prints, still influence artists and designers to this day. This book highlights the research and findings of this natural scientist such as Haeckel’s fundamental monistic notion of the “unity of all living things”.
35. Material World – A Global Family Portrait
Author: P Menzel
Publisher: Sierra Club Books, 1995
Pages: 256
In an unprecedented effort, sixteen of the world’s foremost photographers traveled to thirty nations around the globe to live for a week with families that were statistically average for that nation. At the end of each visit, photographer and family collaborated on a remarkable portrait of the family members outside their home, surrounded by all of their possessions—a few jars and jugs for some, an explosion of electronic gadgetry for others.


