The purpose of this article is twofold. The first is to give a quick comparison between R and Spark, in terms of performance. The second is to introduce you to Spark’s ML library.
Background
As R is inherently single threaded, it may not be wise to compare Spark and R in terms of performance. Though it is not an ideal comparison, some of the numbers below will definitely excite someone who has faced these problems in the past.
Have you thrown a machine learning problem at R and waited for hours? You had to be patient simply because you didn’t have a viable alternative. But it’s time we take a look at Spark ML, which has most of the functionalities of R and is great in terms of scaling and performance.
I once took a specific problem and tried to solve it using different machine learning techniques, using both R and Spark ML as tools. To make the comparison fair, I even used the same hardware and operating system for both of them. And I ran Spark in standalone mode with no cluster configured.
Before we get into the details just a small note about Revolution R. As an enterprise version of R, it attempts to solve the weaknesses of R being single threaded. Getting locked into a proprietary software like Revolution Analytics may not be an ideal long term solution. To add to the acquisition of Revolution Analytics by Microsoft, may complicate things further, in terms of licensing.
Hence community-backed open source tools like Spark will probably be a better option than Revolution R.
Dataset and problem
The dataset taken for this analysis is digit recognizer data set from Kaggle. It contains gray-scale images of hand-drawn digits, from zero through nine.
Each image is 28 pixels in height and 28 pixels in width, for a total of 784 pixels in total. Each pixel has a single pixel value associated with it, indicating the lightness or darkness of that pixel, with higher numbers translating to darker pixels. This pixel value is an integer between 0 and 255, inclusive. It has 785 columns including first column, called “label,” is the digit that was drawn by the user.
The goal is to come up with a model that can predict the digits from the pixel data.
The rationale behind choosing this dataset is that it is not really a big data problem, in terms of the volume.
Comparison
Here are some of the machine learning techniques/steps that were applied to this problem, and resulted in predictive model(s),
- To run PCA and LDA on the data set to come out with principal components (as a feature engineering step).
- To run a binary logistic regression for all pairs of digits (45) and to classify them based on the pixel information and the PCA and LDA features.
- To run Multinomial logistic regression model with the entire data for multi-class classification.
- To run Naive Bayes classification model for classifying the digits based on pixel information and the PCA and LDA features.
- To run Decision tree classification model for the digit classification.
Before these steps, I split the labelled data into training and testing data, to train the model and to validate the performance of the model in terms of accuracy.
Most of these steps are taken using both R and Spark. The details of the comparison are provided below for PCA, binary logit models, and Naive Bayes classification models.
Principal Component Analysis
The main computational complexity of PCA lies in the scoring portion. The logical steps are given below:
- It learns KxM weightage values by running through the data and the covariance table of different columns, (where K is the number of principal components and M is the number features in the dataset).
- When we have to score for N observations, it will be a matrix multiplication operation.
- Between the dataset of dimension NxM and weightages MxK, it will result in NxK principal components. That is K principal components for each of N observations.
In our case, this scoring operation turns out to be a matrix multiplication between the dataset with dimension 42000 x 784 and 784 x 9. When this much of computation was thrown at R, it honestly took more than four hours. Spark took no more than ten seconds to complete the same operation.
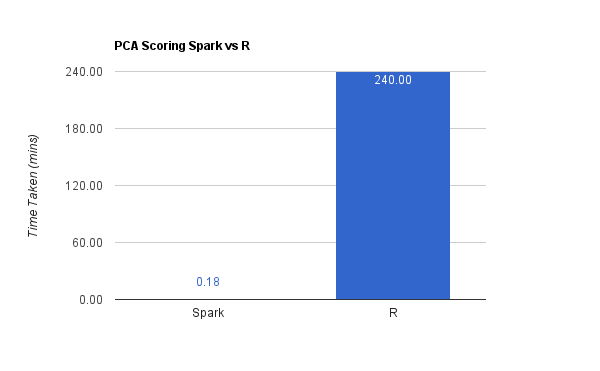
This matrix multiplication turns out to be close to 300 million operations/instructions with quite a bit of other indexing and lookup operations as well. It’s amazing that Spark’s parallel computing engine could finish it in ten seconds.
I verified accuracies of the generated principal components by looking at the variances explained by the top nine principal components. The variances matched exactly with the variances of the top nine PCAs generated using R. This ensured that there is no compromise on accuracy done in Spark for performance or scaling.
Logistic regression model
Unlike PCA in the logistic regression model, both training and scoring are computationally, extremely intensive operations. The training portion in the closed form solution involves some transpose and inverse operations on the matrix of the entire dataset.
Due to these computational complexities, both training and scoring took a while to complete. Seven hours to be precise. And Spark took only about five minutes.
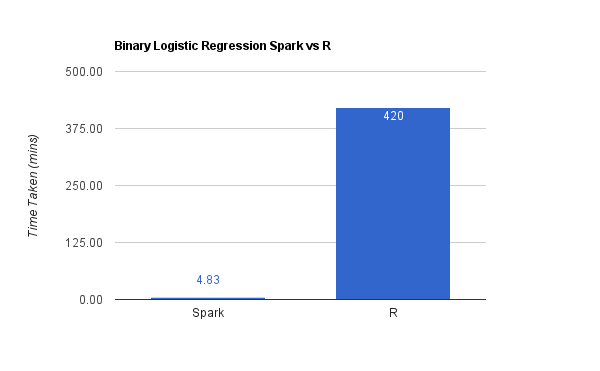
Here, I ran the binary logistic regression model for all forty-five pairs of digits, from zero to nine.
The scoring/validation was also done for all forty-five pairs of test data.
In parallel, I also ran the multinomial logistic regression model as a multi-class classifier, and it took about three minutes to complete. I couldn’t run it with R to provide data points on the comparison.
As in the case of PCA, I used the AUC values for measuring prediction performance of each of the forty five models. The AUC values matched between the models of both Spark and R.
Naive Bayes classifier
Unlike PCA and Logistic Regression, Naive Bayes classifier is not computationally intensive. It involves operations like computing the class prior probabilities and deriving the posterior probabilities based on the additional data available.
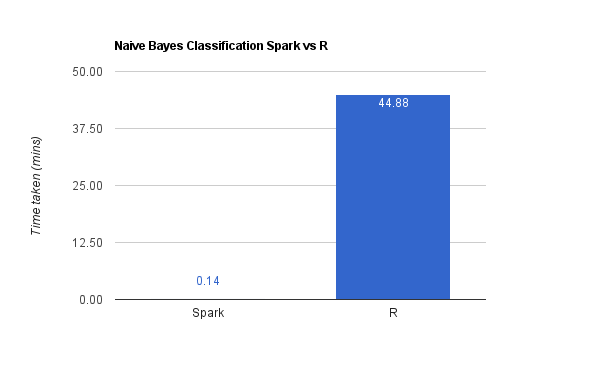
As can be seen in the chart above, it took about forty-five odd minutes to complete. Spark finished it in 9 seconds. As in the previous cases, their accuracies matched.
In parallel, I tried to run the decision tree as well, using Spark ML. It took about twenty seconds. I couldn’t run it in R at all.
Spark ML: Getting started
Enough of comparisons and this build up towards Spark ML! The best place to start with Spark ML would be the Programming guide. Though, if you want to try something quickly or learn by practice, you will have a hard time in getting it up and running.
To understand the sample code provided and to experiment with a dataset, you need to first understand the basic structure and operations supported on Spark RDD. You then need to know the different Spark ML programs and start programming on it. By the time you get your first Spark ML program running, your interest would have probably diminished.
Here are two resources that will help avoid this kind of problem and smoothen the learning:
- The entire source code, for anyone to play around along with R code used for comparison: https://github.com/vivekmurugesan/experiments/tree/master/spark-ml
- The entire source code for the Docker container that comes with Spark pre-installed and with the binary (jar) of the above project to try out even quicker: https://hub.docker.com/r/vivekmurugesan/spark-hadoop/
The Docker container has Apache Hadoop pre-installed and running in a pseudo-distributed mode. It will help put files that are larger in size into HDFS to test with Spark. It is very easy to create an RDD instance in Spark by loading the file from HDFS.
Productivity and Accuracy
People use different yardsticks to compare tools like these. To me, it is the precision and productivity that should decide the tools.
People prefer to use R over Spark ML, due to the steep learning curve. They end up using small samples with R, because R takes a lot of time to process the large samples of data. This affects the performance of the entire process.
To me, using a small sample is never the solution, because small samples can never be representative (at least in most of the cases). Hence, you are compromising on accuracy if you take a small sample.
Once you rule out small samples, it boils down to the issue of productivity. Solving machine learning problems will always be iterative in nature. If each of your iterations is long, then the time to completion adds up. However, if you enjoy the iterations that take a less amount of time, you can afford to spend little more time on writing the initial code.
Conclusion
With the amount of statistical computation packages and visual analysis packages like ggplot2, there is no way R can be done away with. The kind of capabilities it brings to explore data and statistical summarization is unquestionable.
But, when it comes to building a model for massive datasets, we should explore tools like Spark ML. Spark also provides an R package. SparkR can be used to explore distributed datasets with R.
It is always better to have more tools in your armoury, as you never know what to expect in a war. Hence, I will say that it is time to move past R to Spark ML.