In this article, I’m going to clue up about what business intelligence is, why it matters, and what benefits it brings to a business or organization. We’ll also talk about the challenges that commonly arise with companies using SaaS BI services or deciding to implement a custom solution.
Another topic we’ll cover is why companies refrain from implementing BI strategies and analyze how to choose intelligent tools, depending on your business’s goals and features.
This blog post is a call for discussion – feel free to share your thoughts, questions, and, most importantly, stories. Perhaps your experience may be of great help to someone facing the same problem or having a similar situation – you never know.
What business intelligence is
Business Intelligence is a broad term that encompasses various processes and methods pointed at developing business analytics, data mining, data visualization, and reporting within an organization. To make sure we are on the same page, let’s start with a brief, more specific definition of how people usually understand BI.
Business Intelligence (BI) is a set of software tools that gather data from the organization’s activities, drives it through a data processing pipeline to showcase information in a meaningful form according to analytical purposes.
Its central goal is to provide decision-makers with real-time insights and help them make decisions.
Core features that distinguish BI from static reports are interactivity and reliability on regularly updated data, a single truth source.
The motivation behind using BI stems from the need to make decisions truly data-driven, which means supporting them with facts and numbers.
Why business intelligence and analytics are important
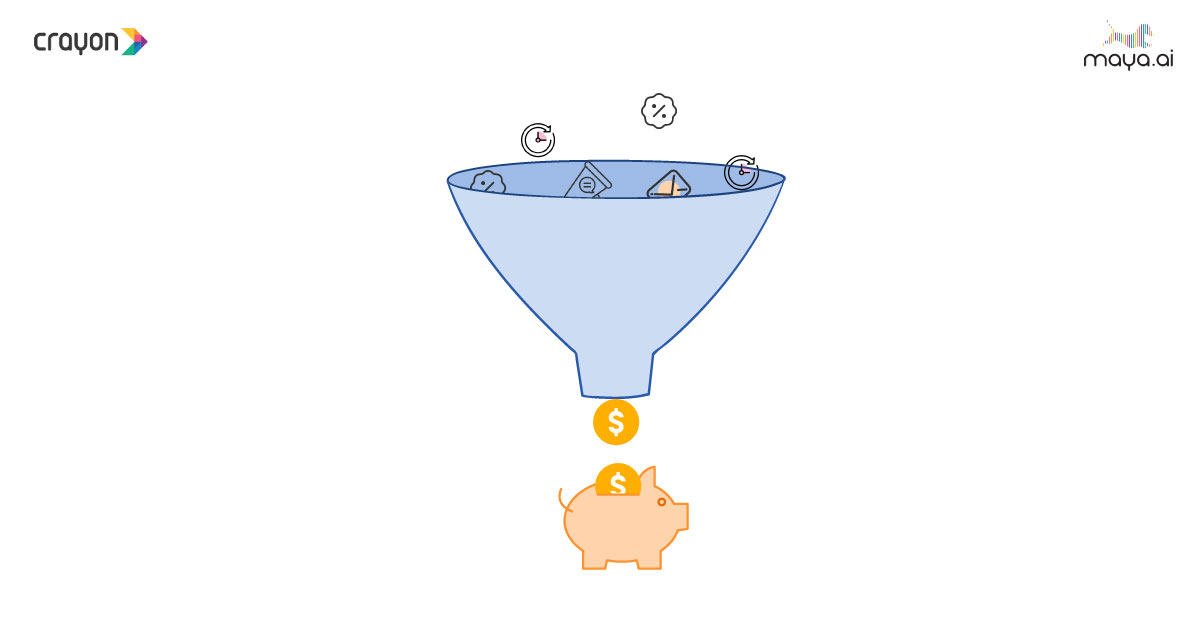
Not paying enough attention to business analytics’ value may lead to losing finances and competitive advantage in the long run. The guesswork approach can never fully replace the data-driven decisions. Right now, tons of insights might be hiding in your shadowed data simply because no one is aware of its potential to change the corporate decision-making culture.
It’s vital to keep a finger on the pulse of your business every minute. And how can you do it better than by trusting on data?
So, enabling your business processes with BI can become a turning point in your company’s growth. The benefits it may bring can balance out the risks associated with BI development.
Let’s consider some of them.
Benefits of business intelligence
- Eliminates the guesswork from decision-making processes.
- Allows less technical employees to analyze data relevant to their field of expertise regularly.
- Allows driven insights from the data.
- Saves time for strategic and high-priority tasks. A properly configured reporting system enables focusing on analytical goals rather than technical details of reports composing. You can forget about storing data in dozens of spreadsheets and performing manual calculations.
The benefits are not limited to this list. Depending on your business case, you may get your own, unique ones.
Signs that you need a BI solution
How to know you need business intelligence for your company or organization?
- Your organization generates vast amounts of data, both structured and unstructured.
- Important information is challenging to find.
- To get data needed for reporting, you have to make requests to co-workers to summarize data.
Reasons why you might not need a full BI solution
Building a full BI solution is often associated with high costs of implementation and IT support since the system must be carefully adapted to the business requirements through customization.
Apart from pricing, another obstacle to implementing BI across all departments is the high learning curve of using it since BI systems often come with an excessive amount of features that may draw away from the daily analysis’s core goals.
Another sign you might not need a fully-featured BI is that you have not so much data to analyze but still have to do reporting on a daily basis.
Instead of a full BI solution or a custom-code one, you can go with embedded reporting tools that are easier to integrate with your infrastructure and have a shorter learning curve. They are often more lightweight but, at the same time, can fully cover the core analytical and reporting functionality.
Embedded reporting as an alternative to BI
Enterprise reporting is at the heart of business intelligence. When designed with business goals in mind, a reporting system offers an effective way to look at the data from multiple angles, notice patterns, and unveil new insights.
A business report‘s core goal is to present the summarized information about a specific department’s performance. It has to be concise and understandable for the target audience. The foundation of a report is the numbers and facts acquired during the data analysis process.
Having considered essential reporting goals, we approach the next no less important question: how to choose reporting tools? How to become a step closer to implementing embedded reporting?
How to choose reporting tools
Firstly, one should research the tools available on the market. Since the cost is not the last aspect to pay attention to, it’s common to opt for free solutions.
Indeed, the market is full of free libraries and components that offer data analysis and data visualization capabilities. But choosing a free solution often comes with a pitfall: the high chances are that it will require further customization to match the project’s requirements. It means investing in the additional development of functionality. Are you ready to do that?
If this scenario doesn’t fit you, instead, you could focus on paid products that offer many more features out of the box and often provide technical assistance.
Speaking of features, I would like to outline some criteria to guide when looking for the right tool.
A near-perfect reporting tool
- Is dynamic and makes data more engaging, meaning end-users can easily interact with it whenever they need to: drill down into data to see it at a granular level or get a bigger picture.
- Works with any data source, whether it’s an SQL database, OLAP cube, or JSON/CSV files.
- Processes and renders data fast.
- Offers self-service analytics features out of the box, e.g., slicing & dicing, interactive summarizing, filtering, and sorting.
- Seamlessly integrates with a project’s technologies and infrastructure.
- Is accessible. Composing reports should be available through keyboard navigation.
- Provides a comfy report designer.
- Supports reports exporting and saving. This feature is crucial for sharing insights within the company.
Other nice-to-have features include
- Integration with mobile platforms.
In the smartphone era, creating and viewing reports on the go is incredibly valuable. Hence, integration with mobile apps would be an additional advantage.
- Data access for different user roles.
A reporting system should allow different users to view dashboards relevant to their expertise. It will help them act autonomically, be more initiative, and make well-informed decisions during their day-to-day tasks. It’s the key to efficiency and productive teamwork.
Compatibility with data securing mechanisms.
How to create interactive reporting dashboards with data visualization tools
Let’s move from theory to practice and see ways to make your reporting shine.
The top popular data visualization tools for building a reporting BI system are interactive graphs, pivot tables, grids, maps, gauges, controls, and more.
Each one performs its role in the dashboard’s ensemble but serves mutual purposes:
to highlight a particular aspect of data;
to communicate insights about what is happening in a specific part of the project.
I want to draw your attention to Flexmonster Pivot Table & Charts – a web-based library for embedding pivot tables and pivot charts into an application. Flexmonster offers data analysis and reporting features all in one. It can serve as an engine of the entire dashboard with its robust data processing capabilities.
End-users can create analytical reports with a friendly user interface.
Developers can bring to life any scenarios around the reporting tool with a JavaScript API or customize its look and feel.
This reporting tool comes with
- out-of-the-box analytical features
- the server-side solution that enables efficient work with SQL databases
- connectors to OLAP sources, MongoDB, and Elasticsearch
- wrappers for modern web frameworks (React, Angular, Vue, Electron, Ionic, etc.)
But the most significant benefit is its speed: the data can be efficiently processed right in the browser.
However, if your data set is large (around or more than 1GB), it’s better to use Flexmonster with the Data Server – a cross-platform utility for a fast connection to a database and boosting data processing.
Here is an example of a reporting solution you can build with Flexmonster:
After such a reporting tool is off and running, every department can get a clear picture of its performance at their fingertips.
Wrapping it all up
This time we revealed the motivation that drives building intelligent solutions, discussed why it’s worth investing in analytics, and examined the core benefits of BI to the company’s performance.
We also touched upon embedded enterprise reporting as an alternative to full-featured BI solutions.
I hope that the presented solution will take an essential place in your company’s data analytics.