The world is talking about data — the good aspects and the bad aspects. There are data breaches and data sharing. There are mistakes we’ve all made with our data and things we can do better with the information we share (and the information we don’t).
But one thing about data is that we, as businesses, are collecting data, and we’re not always sure what we’re supposed to do with it or even whether if we’ve collected the right pieces. For example, the data about purchasing decisions is one of the most important data sets that we can measure. That includes not only our conversion rate, but our conversion rate as it compares to others in our same industry. You also need to know if your customers repeat their ordering, or if it’s a single moment in time, and also how much they are ordering.
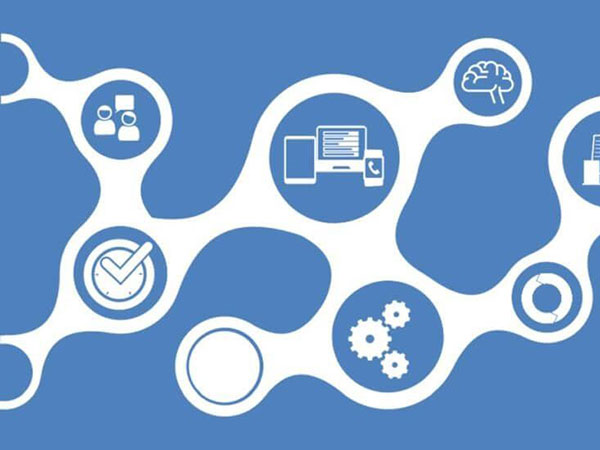
So what’s the data and what are you missing? This graphic explains it.

This infographic originally appeared here. Republished with permission. Submit your copyright complaints here.
