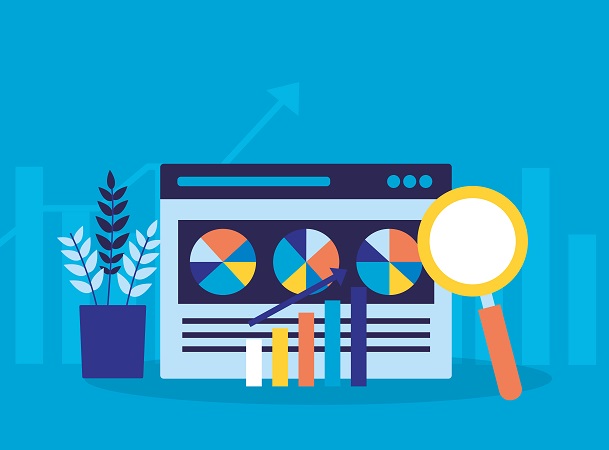
Nowadays there is a great variety of different useful tools for market researchers that are free and open for usage. Today you can use such instruments to enhance your business and significantly improve the effectiveness of your work. Leaving you a chance to waste your precious time searching the best instrument among the abundance of useful online tools, we have already made a list of Top 10 Market Research tools for your business. These tools were chosen because of their free access, ease of use and comprehensive capabilities.
Google Alerts
Google Alerts is the most popular monitoring tool the interface of which is quite understandable and easy. All you need is to enter the keywords for monitoring and indicate the sources (News, Blogs, Videos, and Discussions), a frequency of message alerts (As the results become available, Once a day, Once a week), volume (All results, Best results) and your email. And after that, the system sends you materials corresponding to the given settings. Besides, you have an opportunity to influence the market, follow negative changes on time and take appropriate measures. Also, you can search for potential clients expanding your business. On the other hand, this tool has a limited choice of settings. So, if you want to receive data from other criteria you need to use other payable services.
Synthesio
It’s another great analytics tool which helps you to gather and analyze global data in real time, measure the success of campaigns, perform competitive analyses. In addition, you can analyze the impact of a potential online crisis as well as run quick, high-level queries on brands or topics before building a full dashboard.
KNIME
KNIME integrates data from various sources, transforms and subsequently analyses it. This tool has the potential to perform predictive analysis models, trends and analysis related to Social Media, such as sentimental analysis, network mining, content tagging. It also allows for interactive exploration of analysis results or trained models. Despite the advantages of this tool, it can take you some time to understand how it all works. Additionally, nodes are treated as “black boxes” and thus you can be disconnected from the underlying algorithms, which may lead to incorrect use of some methodology. Taking into account that KNIME integrates well with popular scripting languages such as Perl, Python, and R, developing new functionality isn’t so difficult.
Market Research RFQ-service
Market Research RFQ-service is a brand-new tool among the above-mentioned tools which doesn’t refer to analytics but it’s very helpful as its main function to help marketing and consulting agencies from different countries to generate new leads taking part in the global tenders concerning market research. One of the key advantages of this tool is an opportunity to receive complete information about the tenders without paying any monthly and annual fees. This service is very convenient in use – it contains all the necessary information about the tenders. Moreover, you have a great chance to search new interesting offers for your company as well as submit your own proposals absolutely free.
RapidMiner
RapidMiner is capable of processing, analyzing and modeling data. One of the major advantages of RapidMiner is the possibility of connection with database tools, like MySQL. But apart from this aspect, RapidMiner has good flexibility in process design (e.g. considering the ability of nesting optimization, evaluation, etc.). An additional argument for using RapidMiner is the presence of customized features at a low cost. However, this tool is not very easy in use, so you need to turn to the tutorials. Other big disadvantages of the instrument are the use of large amounts of memory and is often obtained the error “out-of-memory”.
Google Fusion Tables
Google Fusion Tables is a helpful tool for data analysis, large data-set visualization such as maps, charts, graphs, and timelines. Google Fusion is able to handle all types of location data, which is a real advantage. You don’t need to have postcodes to plot your data as it includes geographic information system functions to analyze data by geography. It is an amazing tool both for beginners and advanced beginners to get comfortable with analyzing data. Like other analytical tools, Google Fusion Tables has some disadvantages. Functionality, customization, and data capacity are all limited compared with desktop applications or custom code. The next point is that interacting with large data sets on the site can be slow. And Google Fusion (at least the classic version) can only show one variable at a time.
Node XL
Node XL makes analysis and visualization of network data easier for you by combining the common analysis and visualization functions with the familiar spreadsheet. This tool simplifies the process of network data analysis, making it easier to convert edge lists and incidence matrices into useful visualizations. It doesn’t have all of the flexibility of Gephi in terms of visualization but can produce some quality visualizations. It also interfaces directly with the SNAP library for analysis which gives it access to a good set of efficient algorithms for metric calculations. The main advantage of NodeXL is in its data collection rather than in its visualization or analysis functionality. For example, it can interface with the Twitter API well. Many of the use cases for NodeXL involve the visualization and analysis of social media data.
Tableau
Tableau creates complex data visualization in an extremely simple, interactive and intuitive way. You can highlight sections and drill down into charts without extensive skills or assistance from IT. As a result, you don’t have to take any steps to make dashboards mobile because Tableau automatically recognizes if you are using the mobile app and makes adjustments. Tableau integrates with most data types and big data platforms, including Hadoop. On the other hand, this tool has some cons. While creating the dataset, to begin with still you need IT expertise or the help of someone well experienced in SQL. There is another inconvenience connected with change management issues. So, if you publish your reports and dashboards to the server, then you can’t recover previous versions. Also, you can’t create static layouts or data tables and there is no functionality for scheduling and notification of reports. And the last disadvantage is that the functionality of a free version of Tableau for personal use is limited.
Highcharts
Highcharts is one of the most powerful tools for helping you to create interactive data visualization by means of customizable animations. Setting the Highcharts configuration options requires no special programming skills. This tool has many benefits of using jquery. Firstly, it works perfectly in environments without Flash (e.g. iPad, iPhone), and it’s HTML 5 compatible. Secondly, you can supply data (e.g. such as from a static spreadsheet file, dynamic JSON data from the server, or even an HTML table) and customize the type, appearance, and interactivity of the chart. You can put multiple graph types in a single chart. And you can even print the chart or download as images/PDF. And finally, it’s possible to allow the user to interact with the data source.
OpenRefine
OpenRefine is an excellent tool for working with messy data. It allows you to clean and transform it from one format into another. This tool can help you explore large data sets easily. It has many advantages but it’s worth mentioning the most remarkable ones. The first advantage is that OpenRefine allows you to work with local files or data from web addresses in a number of file formats, including CSV, TSV, XLS, XML, and other formats. The second one lies in the ability to filter or search for certain elements that need to be changed in some way. Then you can perform the desired action on just those entries. At last, it provides a quick analysis of the data contained in the file sorting the words by count. Furthermore, it helps researchers to perform basic as well as not so basic operations with data without writing any code.